Orthogonal Ensembles and Tested Explanations for Performer-Independent Body-Motion Emotion Recognition

MMAC Challenge at ACII 2026 · Oral

The University of Tokyo Ishiguro Laboratory, The University of Tokyo ACII 2026

Reading emotion from body motion alone

Entrants name the emotion in a motion-capture recording of a single performer. The system sees 24 joints on the body plus one point for where the body is in the room: no face, no sound, no scene.

12 emotions to choose from anger to pride, all acted
8.3% guessing gets this right one in twelve
74 / 18 performers, train / test no one is in both
7,992 training recordings 1,944 held back

Orthogonal errors

Combining models pays only when they are wrong on different recordings.

Tested explanations

Every claim about what the model reads is a test that can come back negative.

Each recording is one performer acting one emotion; every model here reads a fixed 64-frame window of it, about half a second. The recordings come from DIEM-A, the Diverse Intercultural E-Motion Database of Asian Performers.

The setting is what makes this hard

Two people performing the same emotion differ about as much as one person performing two different emotions.

Close emotions move alike

Jealousy moves like contempt, and shame moves like guilt.

Every performer moves differently

The people in the test recordings never appear in training, so learning how one person moves buys nothing.

We retrained the organisers’ reference model, STGCN++, on this split: 25.73 ± 4.03% Macro-F1, against 8.3% for guessing. A better network on its own gains little here.

Every score here comes from 10-fold leave-performers-out cross-validation over the 74 training performers, reported as the per-fold mean ± SD.

The single-model route ran out first

Every upgrade to a single model failed or made the score worse.

  • A supervised-contrastive head cost −11.53 pp.
  • Aligning recordings to scene descriptions cost −1.42 pp: the projection collapsed onto performer identity, not emotion.
  • Pseudo-labels from a vision-language model failed: on faceless stick figures it ranked the true emotion last of twelve.
  • Post-hoc calibration moved the score by 0 to −0.14 pp.
30.05 ± 3.48% best single model Macro-F1, same split

All on the same ten-way performer split. The paper lists eight of these; together they are the ceiling on one better network.

Combine models that make different mistakes

Averaging cancels a mistake only when the members do not make it together, so the members were chosen for how differently they fail.

Capacity

More capacity in one network. Under this split it did not transfer to performers the model had never seen.

Diversity

Eleven models whose assumptions about motion differ, so the recording that defeats one family is not the one that defeats the next.

This can fail. If the gain came from parameters, the members’ errors would coincide and dropping one would cost nothing. Both are measured later in the talk.

Each family assumes something different about motion

One larger network was the alternative. The capacity went to these four assumptions instead.

Motion travels along the skeleton

Graph, 4 · STGCN++, CTR-GCN, ProtoGCN, Region-Aware ConvTr

Distant joints and moments count together

Attention, 1 · SkateFormer

The clip as pooled statistics

Hybrid MLP, 2 · Conv1D+Transformer, Keypoint-Pool-MLP

Motion learned on other corpora

Frozen external, 4 · MAMP NTU60 and NTU120, MotionBERT-Lite, C3D-marker-stats

The frozen branches disagree with the rest more than any other family, and removing that block costs −2.91 pp.

Seven members trained here plus four frozen branches with a linear head each: 12.98 M trainable parameters.

Equal weights, raw logits, nothing fitted

Add the eleven logit vectors and divide by eleven.

Why equal weights

A fitted weight is fitted to the performers in the training folds, which is the thing that does not transfer here.

Why raw logits

A softmax first bounds how far one member can disagree with the rest.

+1.15 pp logit mean over probability mean same members, same folds
+0.99 pp members z-scored first scale removed
+0.69 pp ranks only, Borda fusion magnitude discarded

The two smaller figures are the same comparison with the members rescaled and then with their magnitudes thrown away, so the gain is not an artifact of one member's logits being larger than another's.

Averaging the eleven models adds +11.07 pp over our baseline rerun

36.80 ± 4.00% all eleven models, logit-mean Macro-F1, 10-fold leave-performers-out
25.73 ± 4.03% the organisers' STGCN++, rerun by us same 74 performers, same folds
+43% relative gain +11.07 pp absolute

The gain excludes zero in all ten folds, and again when we resample performers.

These scores come from the training performers. On the organisers' hidden test set the same system scored 37.23% Macro-F1, inside this range, and took the Best Performance Award.

95% CI on the gain: [9.86, 12.33] pp by fold, [9.14, 12.17] pp by performer. The organisers' published baseline over all 92 performers, 25.21 ± 4.49%, sits within one SD of our rerun; we quote it for reference and measure the gain against the rerun.

The gain builds one model family at a time

Baseline, best single model, seven members, then eleven: 25.7 → 30.1 → 33.9 → 36.8%.

The ensemble beats the best single model by +6.8 pp, more than any change of architecture bought us.

The last step is the four frozen external branches joining the seven members we trained ourselves.

Each bar is the mean over ten leave-performers-out folds, each dot is one fold, and the pooled out-of-fold score sits beside each bar.

Orthogonal errors: the members rarely fail on the same clip

Pairwise error correlations stay between 0.15 and 0.43, and they are lowest for the four frozen external members.

Removing any one member costs −0.84 to −0.09 pp. Removing all four frozen external members at once costs −2.91 pp.

Correlations run over per-sample error indicators on 7,992 out-of-fold clips. The removal costs are pooled out-of-fold Macro-F1 against a base of 36.94%.

The errors fall between emotions that move alike

Jealousy reads as contempt and guilt as sadness, and top confidence sits near 62%.

The country difference is not a cultural finding.

Japanese and Taiwanese performers score 35.3 and 38.9%. The two groups also differ in when they were recorded and in how each person moves.

Dropping the seven earliest Japanese performers from training moves the score by −0.44 pp.
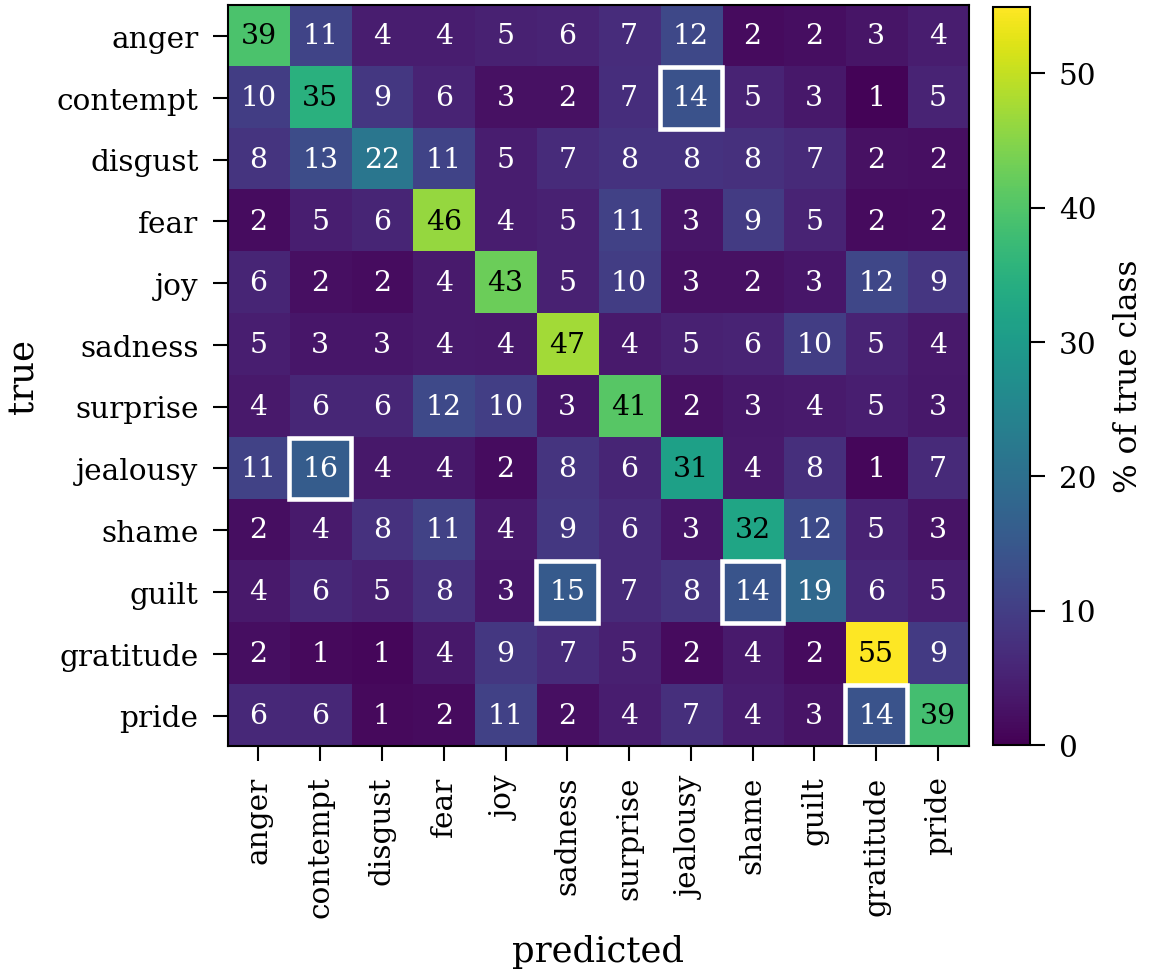
Row-normalised 12-by-12 confusion matrix for the eleven-model ensemble, with the five strongest off-diagonal cells boxed.

Row-normalised out-of-fold confusion over the twelve emotions, with the five strongest off-diagonal cells boxed.

The recording-date check gives 36.50 against 36.94% pooled out-of-fold. The same motion also decodes which country a performer is from about 69.8% of the time, which is another reason not to read the country gap as culture.

Explanations you can test

A saliency map cannot come back wrong. A test can.

The second half asks which parts of the body the model uses, and answers by interfering with the movement instead of drawing a picture of it.

Six checks, five positive and one negative

To claim the model uses a part of the body, we mask it, perturb it, or edit how it moves, and watch whether the prediction moves.

Uses what it points to masking those parts hurts most, +0.124 ± 0.031
Steady under noise the ranking holds, +0.983 ± 0.039
Matches a movement analyst +0.500, against +0.033 for classical kinematics
Edits move the prediction freezing the head changes 41%
Its written accounts hold up 0 of 50 claimed more than we measured
Cannot pick out a frame reported negative, the same gap is about +0.002

All of this runs on the finished models, so nothing is retrained and no accuracy is lost.

Each check runs on one strong member of the submitted ensemble; the two that carry the most weight are re-run on all eleven.

The model uses the parts it ranks high

Masking the parts it ranks high costs more accuracy than masking the parts it ranks low, and the ranking barely moves under noise.

One strong member of the submitted ensemble. The paper's explainability table carries all six checks.
Check Metric Value Consistency
Part-masking AUC gap, important order minus reverse +0.124 ± 0.031 positive in all 10 folds
Stability Spearman ρ under noise at σ = 0.02 +0.983 ± 0.039 the top part never flips

Without these two, the alignment on the next slide would be a picture agreeing with itself.

Masking works over 6 body parts here and the next slide's alignment over 4 regions, two groupings for two checks. At the finer 25-joint resolution the gap grows to +0.199. Both values are 10-fold means.

The model reads the body the way a movement analyst would

Laban Movement Analysis is a movement analyst's vocabulary for how a body moves. People wrote its rules; nothing learned them from our recordings.

  • Saliency over the four regions, head, arms, legs and torso, ranks the way the Laban attributes do: ρ = +0.500.
  • Classical kinematics is the control that makes +0.500 a result: per-joint speed, acceleration, range of motion and energy reach +0.033, about 15 times weaker.
  • Sadness reads as a bowed, sunken posture: head down, trunk forward.

One strong member. The 12 emotions are not 12 independent observations, so the 95% CI [+0.150, +0.733] is an emotion-block bootstrap and the null permutes regions within an emotion, p < 0.001. Positive for 10 of the 12 emotions (sign test p = 0.039, median ρ = +0.70).

The alignment holds for the submitted ensemble, and the edits move the prediction
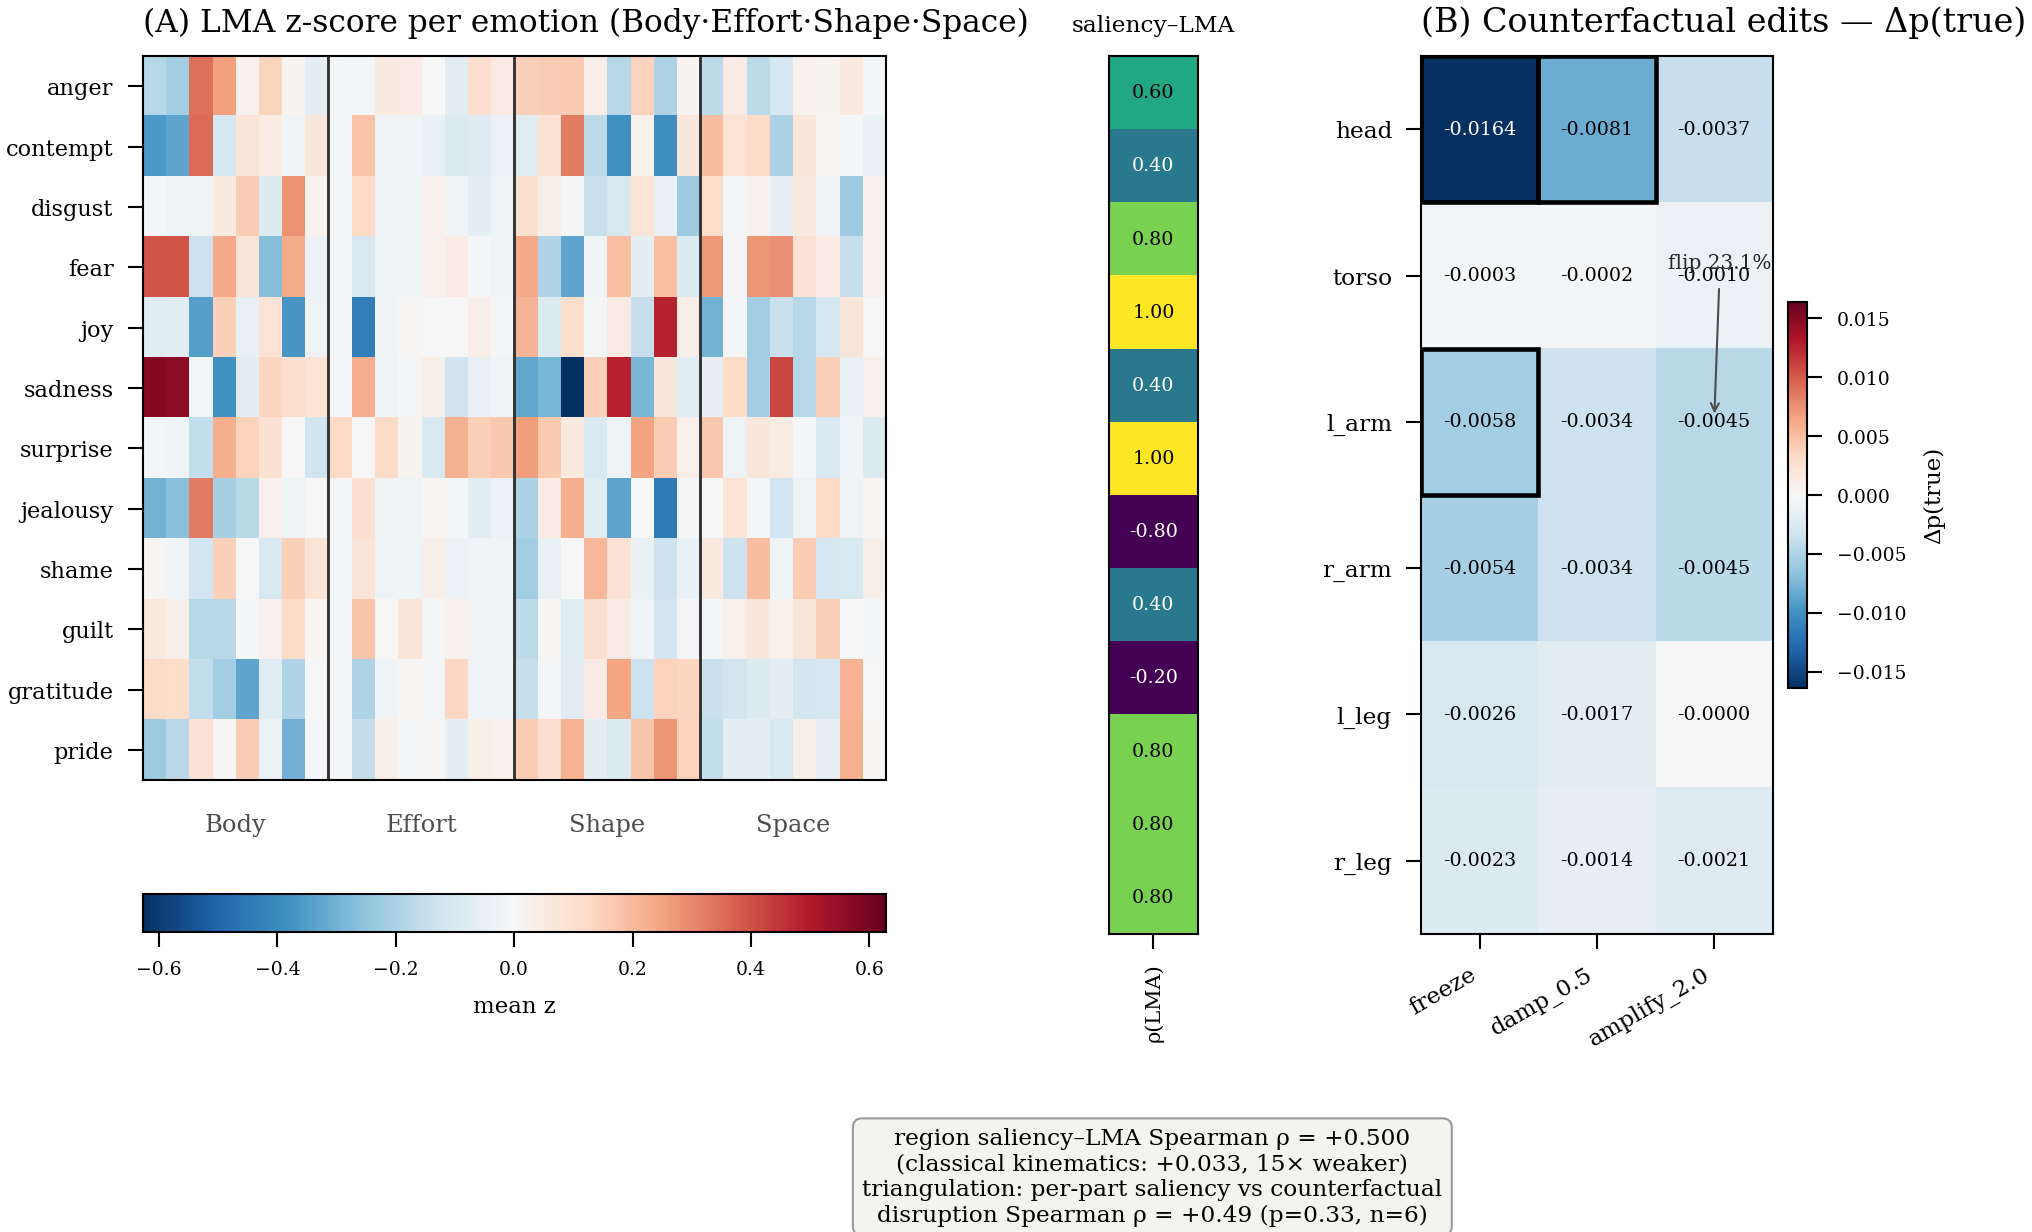
ρ = +0.517 the same alignment, all eleven members 95% CI [+0.333, +0.700], p = 0.001
41% predictions changed by freezing the head largest fall in true-class probability, −0.0164
23.1% changed by amplifying one arm the parts rank as they did under masking
0 / 50 written accounts claiming more than we measured each puts one decision into words
Panel A, the average Laban scores for each emotion beside a strip showing the model's saliency over each region. Panel B, the change in true-class probability under each motion edit.
Panel A, the alignment from the previous slide. Panel B, the motion edits.

These edits corroborate the finding. They are not causal proof, and the main evidence is still the +0.500 against +0.033 alignment.

The negative we report

Inside the half-second the model reads, every frame counts about the same, and across the body the head and neck dominate. Order still matters: reverse the clip and every model that reads it in order loses 3 to 5 points.

The window is 64 frames, about half a second at 120 fps. Across frames the important-versus-reverse gap is about +0.002, against +0.124 ± 0.031 across body parts, and frame saliency entropy is 98.7% of its maximum per clip, 99.5% as a class mean. The null is about locating a frame, not about time.

One idea behind both halves

Scores vary about fourfold across performers, and the spread splits in two.

Half is intrinsic difficulty

Some performers are hard for every member.

Half is model-specific error

Averaging members whose errors are orthogonal cancels it. The explanations describe the same disagreement.

Where we are honest

  • Macro-F1 is low, so we claim a relative gain: +43% over our baseline rerun.
  • 10-fold cross-validation on the training performers. The contest test set gave 37.23% Macro-F1, one score inside that range.
  • Laban alignment is a match in vocabulary. Masking and motion edits test dependence separately.

Recordings paired with written explanations are not released while consent and licensing are under review.

Orthogonal errors win, and explanations can be tested

  1. When movement alone cannot settle the answer, combine models that fail differently.
  2. Test the explanations, and report the checks that come back negative.
  3. Our system reads body regions as a movement analyst would: for sadness, a bowed, sunken posture.
+11.07 pp
gain over our baseline rerun, same split
36.80 ± 4.00% vs 25.73 ± 4.03%
ρ = +0.500
Laban alignment for one model
+0.033 for classical kinematics, +0.517 for all eleven
6 checks
five pass, one reported negative
post hoc, at no accuracy cost

Thank you. I am happy to take questions.

Naoto Nishida and Yoshio Ishiguro, The University of Tokyo